inTune • ISSUE 01 | FEBRUARY 2011

inTune • ISSUE 01 | FEBRUARY 2011
www.dbsophic.com | DOWNLOAD QURE for SQL Server
![]()
In this Issue
- Editor's Note
- Featured Article: SQL Server Logical Reads
- Product News: Qure Workload Profiler
- Tip: Multi-dimensional Analysis of SQL Server Trace Files
Editor's Note
Dear Friends,
We are very pleased to present you with the inaugural issue of InTune, a new eMagazine for the SQL Server community, sponsored by DBSophic. InTune will be published quarterly, with each issue featuring one or two in-depth technical articles by leading SQL Server experts. In this issue, MVP Ami Levin investigates the true meaning of SQL Server’s “logical reads” counter.
Each InTune edition will also provide you with useful tips and techniques, as well as keeping you up-to-date with DBSophic news. Today we are especially proud to announce that a vastly updated version of the FREE Workload Profiler tool is available for download.
We look forward to your comments and suggestions!
Sincerely,
The InTune Editorial Team
This email address is being protected from spambots. You need JavaScript enabled to view it.
Featured Article: SQL Server Logical Reads - What Do They Really Tell Us?
By SQL Server MVP Ami Levin
SQL Server trace, the most common tool DBAs use to evaluate query performance, provides the 'logical reads' counter on which many DBAs rely for evaluating a query's I/O performance. In this article, we will examine this counter's true meaning and provide examples that prove it can sometimes be quite misleading..
I am sure you have all used SQL traces to evaluate the performance of queries and batches. The most common data columns used for this purpose are Duration, CPU, Writes and Reads. These are in fact the only true performance metrics available for a SQL Server trace event... Read more >>
NEW! Qure Workload Profiler – Free tool for analyzing and comparing trace files
A vastly improved version of Qure Workload Profiler has been released and may now be downloaded from the DBSophic website.
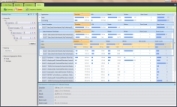
 Qure Workload Profiler is a FREE solution for analyzing and comparing SQL Server trace files. Using the intuitive graphical interface, you will be able to identify and analyze performance bottlenecks. For example -- thanks to multi-dimensional grouping, sorting and filtering -- you can easily isolate the most resource-consuming SQL statements, applications, users, hosts and more.
Workload Profiler also introduces the ability to compare database workloads before-and-after a hardware change, version upgrade, or tuning effort. Even dissimilar workloads can be reliably compared, thanks to Workload Profiler’s powerful equalization and weighting capabilities.
Tip: Multi-dimensional Analysis of SQL Server Trace Files
By SQL Server MVP Ami Levin
SQL Server traces can be a lot of fun to read and analyze in their native form. Natively, you can either use the profiler interface to browse through millions of events, or query a trace table using complex functions. But extracting meaningful data and seeing “the forest for the trees” can often be a challenge. Fortunately, Microsoft and 3rd party vendors have released tools to take some of the fun out of this task. Popular free tools include RML Utilities from the Microsoft CSS team, ClearTrace from fellow SQL Server MVP Bill Graziano, and our very own DBSophic Trace Profiler. More recently, cloud-based offerings have emerged, including Quest Software’s Project Lucy and an online version of ClearTrace AKA TraceTune.
All the above mentioned tools share one significant limitation; they focus on de-parameterizing statements and grouping them by template to pinpoint the top resource consumers. In many cases this is exactly the information you are looking for, especially when performing query-by-query tuning. However, trace events include many other dimensions (or properties) of the workload that provide extremely valuable information. Often the answer to a thorny performance problem lies hidden within these additional dimensions. Read more>>

