By Aaron Bertrand, SQL Server MVP
In 2010, SQL Sentry introduced to the SQL Server community a free tool called Plan Explorer. This tool is designed to make it much easier to interpret execution plans than you can do with the native functionality found in SQL Server Management Studio. While some of the features are instantly obvious, such as color highlighting of expensive nodes, some others are a little more obscure. And it is not necessarily automatic to correlate those details with the actual problem they're highlighting. So I thought I would take a few moments and point out a couple of nagging query issues that Plan Explorer calls out for you. Note that these are based on actual execution plans, not estimated.
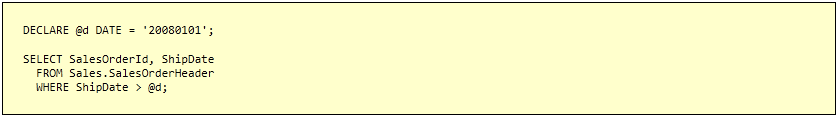
Query optimization relies heavily on statistics and estimates. Different paths can be taken by the optimizer depending on how many rows are expected to be in a certain table or satisfy a certain condition. If these numbers are off, the optimizer can make a bad choice, and query performance can suffer. These symptoms can manifest in many ways, such as a hash join being used instead of a loop join, or high CXPACKET waits because one thread in a parallel query ended up dealing with all or most of the rows. The join methodology won't be obvious in the graphical plan unless you *know* what type of join would have been optimal (and notice that it wasn't the join type actually used), and how much work each thread did is not displayed in the graphical plan at all. There are also other cases where the operations within the query can lead to bad estimates. In all of these cases, you will first be made aware of a deeper problem simply by seeing an orange highlight pointing out differences between estimated and actual rows. Consider the following query (using AdventureWorks2012):
The Statements Tree in Plan Explorer highlights the difference between estimated and actual rows:

These highlights will also appear on the Plan Tree, Top Operations and Query Columns tabs, making them tough to miss:
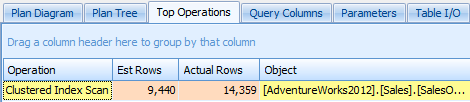
Once you see this difference highlighted in any of these tabs, it could indicate an issue you'll want to look into. This specific discrepancy could have been caused by out-of-date statistics, but it was more simple than that: it was caused by estimates based on the operation (greater than). It assumed that 30% of the rows would meet the criteria, with no actual consideration for the value itself. (You could work around this issue by adding OPTION (RECOMPILE), for example, but the point here is not necessarily to solve this specific issue.)
However, the situation could have been different. Instead of an ad hoc query, let's say this was a stored procedure with slightly different logic:
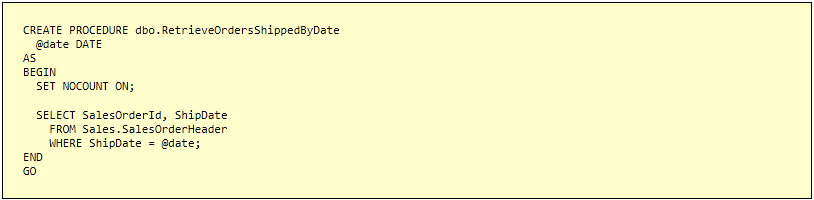
Now let's say the first time you run this procedure, the parameter is May 8, 2008:

This returns 273 rows, so far so good:

Now let's say the next time you run the procedure, the parameter is September 27, 2005, a day with only two sales:

This returns two rows, but look at the highlighting we see again on the estimated vs. actual rows:

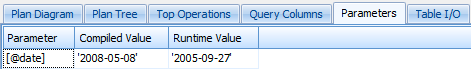
While a recompile may help this scenario, Plan Explorer can give us a slightly better clue about exactly why. The Parameters tab for this plan will show that the parameter value the compiled version of the plan is based on differs from the parameter value ar runtime, showing that this is clearly a parameter sniffing issue.
So again, depending on what kind of performance hit you are seeing from the "estimates are off" plan, you may decide to "fix" this using OPTION (RECOMPILE), or by manually evicting the plan from the cache (in the case where it is a very atypical parameter value), or by introducing a local variable, or by investigating potential indexes or updating statistics.
Conclusion
I hope this demonstrates a few ways in which Plan Explorer makes it easy for you to narrow down potential issues in your troublesome queries. I chose simple examples intentionally to focus on the features in Plan Explorer instead of making you think too hard about the solutions. :-)