By Ami Levin, SQL Server MVP
Adding indexes to a table to improve data access paths is one of the most effective ways to optimize workload performance. I’m sure you’ve all witnessed first-hand how a carefully crafted index is capable of dropping the duration of a query from hours to just a few seconds. This technique is extremely effective, and relatively low-risk, compared to the alternatives of rewriting the query, redesigning the process, making schema changes or even upgrading the hardware and software. It is so effective, that sometimes we overlook the risks involved with it. In this short article, I would like to focus on an issue that one of my clients experienced recently - an issue that nearly brought their production environment to a complete halt.
Let’s start with what I’m not going to cover here:
- Clustered vs. non clustered index performance - I will cover some interesting aspects of this topic in a future article. Searching the web will give you links to many articles on the subject.
- The performance impact that adding more indexes incurs on data modification operations - This topic has been discussed extensively as a part of other subject matter. However, when researching for this article, I’ve looked for a serious, in-depth benchmark publication to refer you to that focuses only on this topic and did not find one. I envision another article in the near future…
- The menace of over-indexing -Tools like DTA and missing index DMVs make it easy for DBAs to keep creating more and more indexes, and (in most cases) with great success. However, I’ve often seen the unfortunate results of this ‘index-trigger-happy’ approach in the form of extremely over-indexed databases. Not only did I see databases that had multiple identical indexes (these serve no purpose other than to degrade the performance of data modifications) but I’ve seen even more cases where highly redundant indexes exist in abundance. For example: an index on columns A, B and C; another on A and B; and a third one on A and B plus C as an included column. If C is a column of relatively small size - even without knowing the workload - I would say it’s pretty safe to drop the latter two indexes.
The reason over-indexing can occur even under the guidance of DTA (and the likes) is that such tools look at indexing on a query-by-query level. These tools may be perfectly right in concluding that one query needed an index on A, B, C and another query needed an index just on A and B, but in the bigger picture, the former would have been enough to cover both nearly as efficiently.
The above items are common knowledge and I’m sure most DBAs consider them seriously before adding or changing indexes in production. However, there is another consequence of the Create Index statement that is less commonly known. It is a sneaky, well hidden menace… lurking, waiting to raise its head and bite when you least expect it. And it can bite really hard…
As examples speak louder than words, I would like to provide a real world example that I’ve recently witnessed that demonstrates my point clearly.
An organization I work with was performing index and code tuning on an on-going basis. The database was a highly loaded one, serving millions of transactions per hour. It contained more than 1,000 tables and more than 5,000 other objects (stored procedures, functions, etc.).
Of course, they didn’t optimize everything at once. Rather, they chose a few “notoriously badly performing” procedures at a time and applied the optimizations in batches as part of their routine patching system. One day we got a phone call from the person in charge of the databases telling us, “We applied some new indexes over the weekend, and today the server performed so badly it was pretty much useless. We rolled back the index changes and everything went back to normal operation. Can you please help us explain how this happened?”
Luckily, they had a trace of the database workload when it was badly performing so first thing I did was load that trace into Qure Profiler and compare it with a trace of ‘normal’ operation hours. Here are the results of a batch-template-matched and fully equalized comparison:
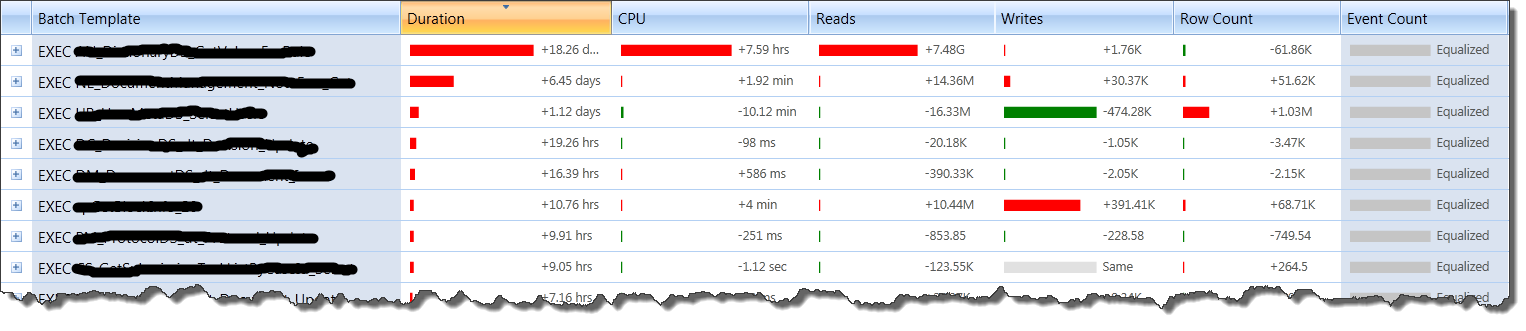
- Procedure names erased for confidentiality.
- Note that the difference in row counts accounts for an insignificant portion of the difference in performance as different parameter values were used. In studies where row count differences are significant, this can be overcome by performing batch-instance level matching (see this tip for more details).
It’s very interesting to see that all top procedures took longer to complete (duration change is red, or worse, for all), but the only one that actually had significant degradation of resource consumption is the first one, which we’ll call PROC1. This agrees perfectly with their production monitoring observations that locking was the prime reason for everything running slow. PROC1 started taking orders-of-magnitude more time than before. This clogged the CPU and locked resources for long durations, causing all other queries to wait. A deeper look at the properties of the PROC1 query reveals the true magnitude of the disaster:
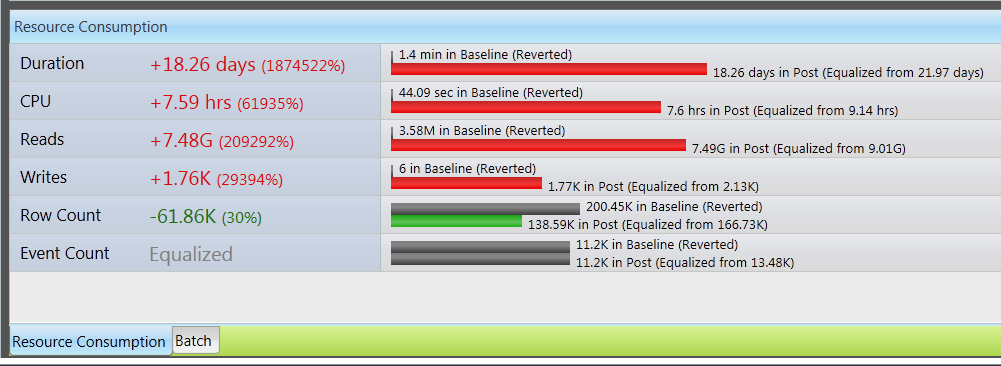
Look at the percentage increases! OK – guilty party found, but why did it misbehave so badly?
The query includes multiple filter predicates from a few tables (blacked out for confidentiality), including two columns from a table we’ll call “X”. One column we’ll call “eID” and the other “yID”. A quick look on the original (quickly performing) execution plan reveals the following:
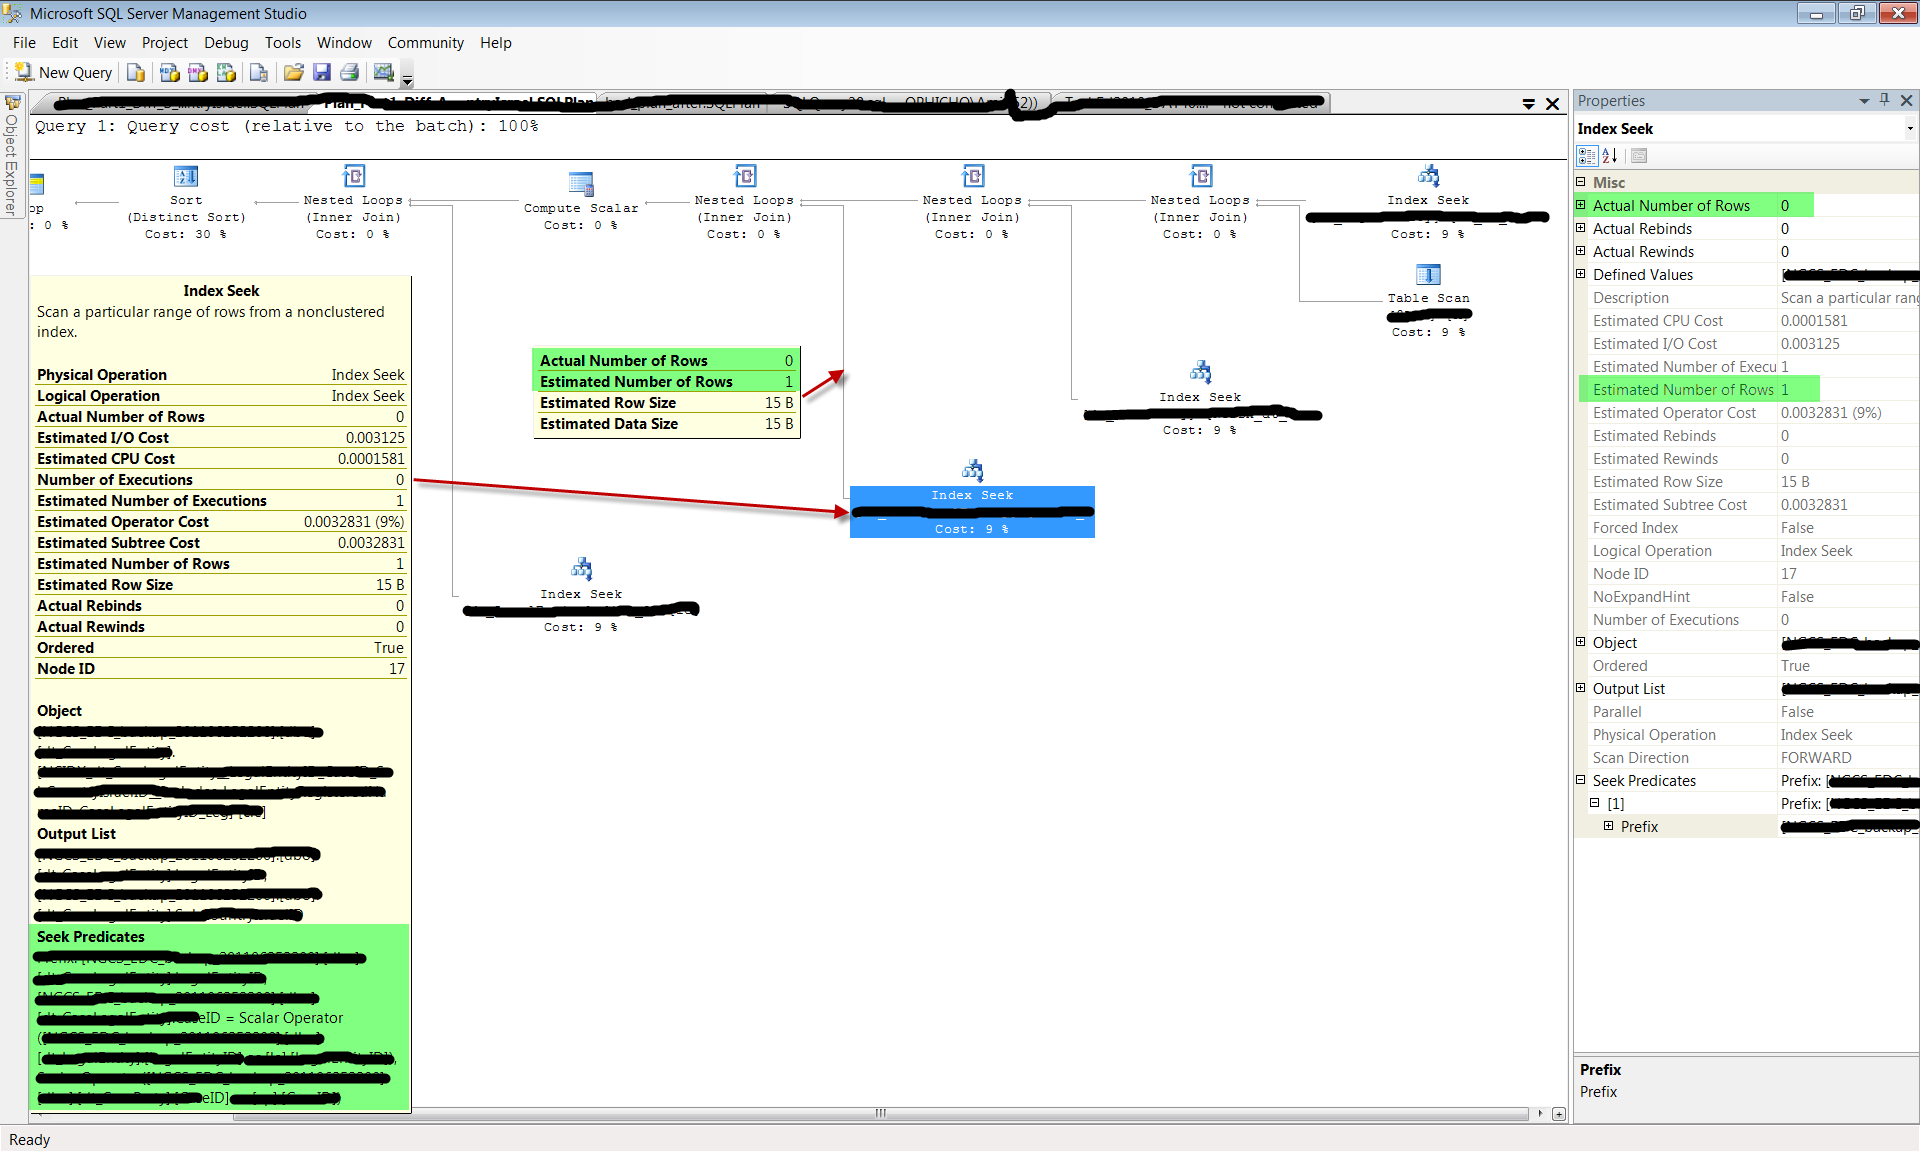
As you can see, the access to the highlighted table X was done using an index seek for column eID (see un-erased part of the index seek properties). Table X was accessed relatively late in the plan, after previous joins already filtered out many of the unneeded rows, and for the shown parameters, only 1 row was retrieved from table X. Note that the estimated number of rows is highly accurate compared to the actual number of rows. In fact, the SQL Server query optimizer did not have many options here as column yID, the other column this query filters on was simply not indexed. This turned out to be a very efficient plan and the query executed in fractions of a second.
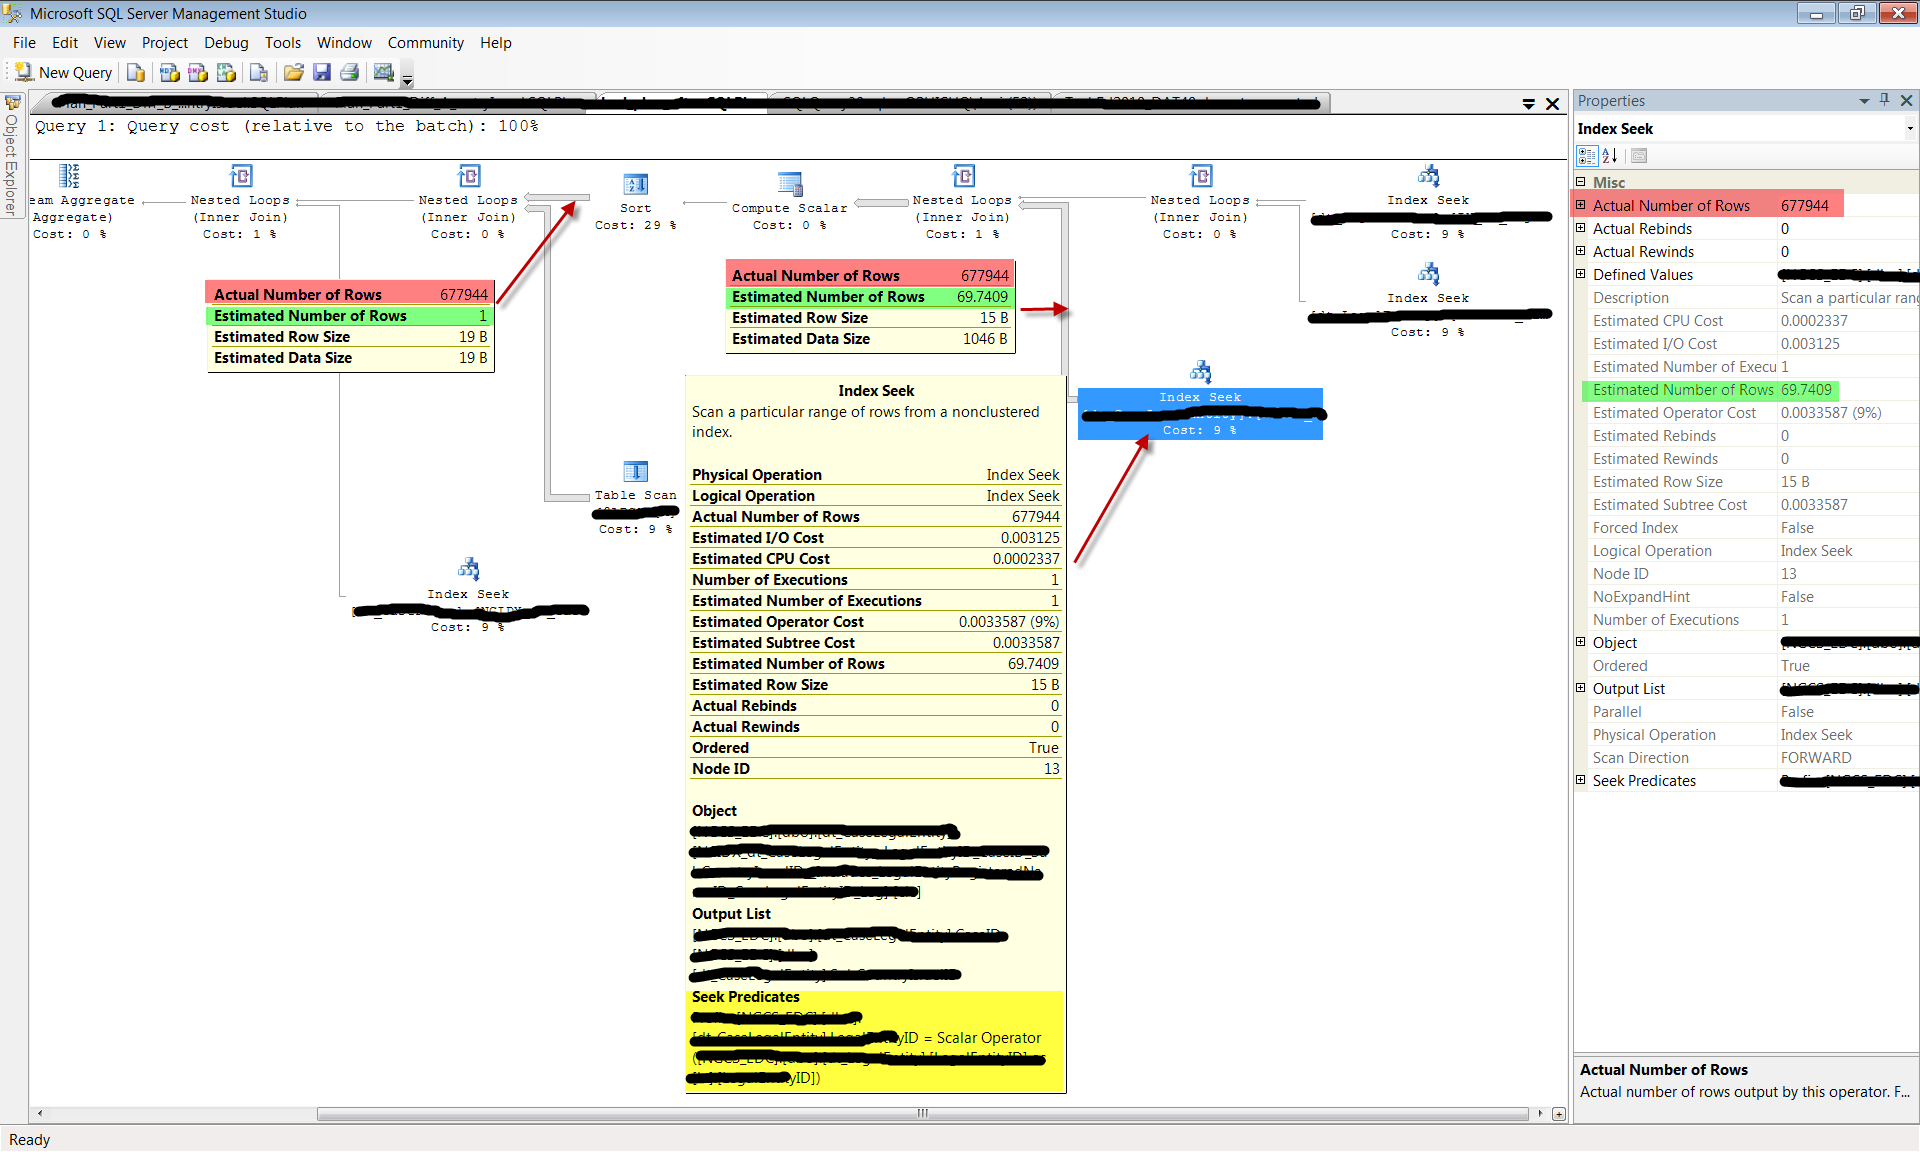
However, the addition of a new index opened far more execution opportunities for the query optimizer. Namely, the new index enabled the query optimizer to filter the rows from table X on column yID. Because the estimate for the selectivity of column yID was less than the selectivity estimated for column eID (see estimated number of rows returned by from table X by filtering on yID is 69 as opposed to 1 in the original plan) the query optimizer plan decision tree took a different route this time. The query optimizer believed that filtering table X by column yID earlier in the plan would enable it to join the additional tables more efficiently. Since it assumed only 69 rows will be returned, it chose to perform a nested loops join, using the expected 69 rows as its outer loop. This assumption proved disastrously wrong. Rather than only having to iterate the outer loop 69 times, it was forced to perform nearly 700,000 iterations! Looking at the plan below, you can see that nearly 10,000 times more rows than expected were returned from table X (677,944). This misestimation can be due to any of a number of different reasons, including (but not limited to) statistics skews because of partial scans of the data, predicate type conversions, untrusted or missing foreign keys that hinder the query optimizer from accurately estimating referencing statistics or simply a query optimizer bug. For this article, the reason for the misestimation is less important because in most cases there is little we can do about it. The point is that you should be aware that this CAN happen and you need to be aware of it in order to minimize unpleasant ‘surprises’ in production after applying seemingly innocent indexes.
Note: One might speculate that the table scan which comprises the inner operator of this nested loop contributed to the overall slowdown. In this case it did not. It was a relatively small table variable scan so its cost was not high per-se. It’s the fact that it was done 700,000 times that was detrimental.
 The end result of adding this ‘harmless’ index on a rarely modified table was to make this query’s completion time explode from fractions of a second to nearly 30 seconds. To make matters worse, this query was executed about 10,000 times every hour. The overall effect on the server was to consume 7.6 hours of CPU time instead of 44 seconds, and 7.5 Billion page-reads instead of 3.5 Million… per hour! The rest is history.
So, what can you do to avoid (or predict) these “mishaps”? Well, unfortunately not much.
If you can’t afford to run a full QA cycle for every individual index prior to migrating it to production, then using tools like Qure Profiler and Qure Optimizer can be of great help. Both these tools test and clearly pinpoint the precise impacts of a collection of index modifications to ALL queries in your workload. In addition, Qure Optimizer can save you the effort of manually predicting when to design new indexes, as it takes into account the entire workload and prepares precise recommendations for a holistic, optimized package of indexing changes using empirical benchmarking.
Once you know that your new (manually designed) index is going to significantly affect other queries for the worse, and can see the improper execution plan choices sometimes made by the SQL Server query optimizer, these negative outcomes can be corralled by means of query hints or plan guides to assist the query optimizer in making the right decisions. Other methods exist that can affect the plan choice: modifying the index scheme, using alternative syntax or tweaking the database (and server) settings. However, this is ‘playing with fire’. Why? Because tomorrow, any change to the environment, such as a change in data distribution or installing a service pack, may cause the query optimizer to revert to the ‘bad’ plan once again without warning. If you decide to use a plan guide or a hint, just remember to reevaluate it periodically as you might be missing better plan alternatives in the future. In our case, the customer decided simply not to apply the new index.